

Greenlaw Flagstaff days on market did not behave the way most sellers expect over the last six months. In the blended Upper Greenlaw and Lower Greenlaw sample, the homes that closed under $500,000 sat on the market the longest, and the group of homes just above them sold faster. Seventeen closed residential sales in Northern Arizona MLS Areas 425 and 430 between February 24, 2026 and August 24, 2026 tell a story about condition and presentation, not about price alone.
That single conclusion is worth more to a Greenlaw seller than any citywide headline number, because it changes what you do before the sign goes in the yard.
The short version:
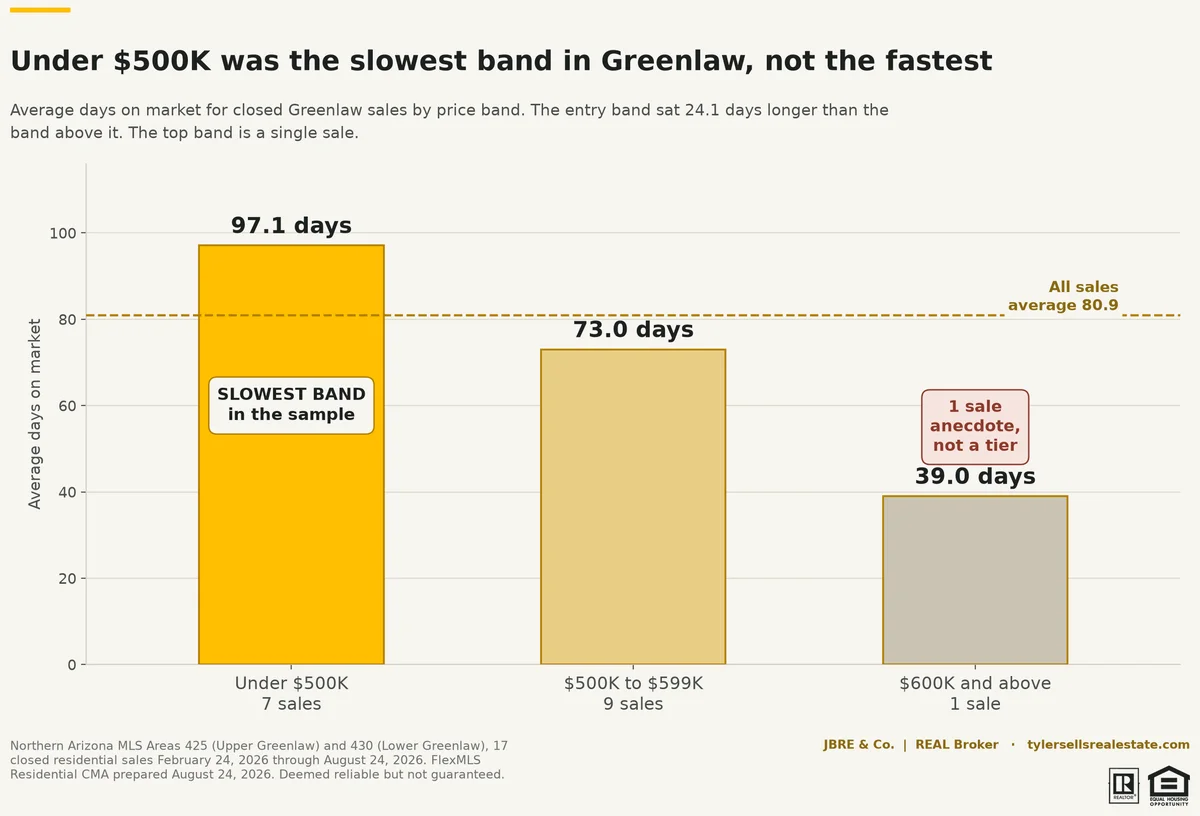
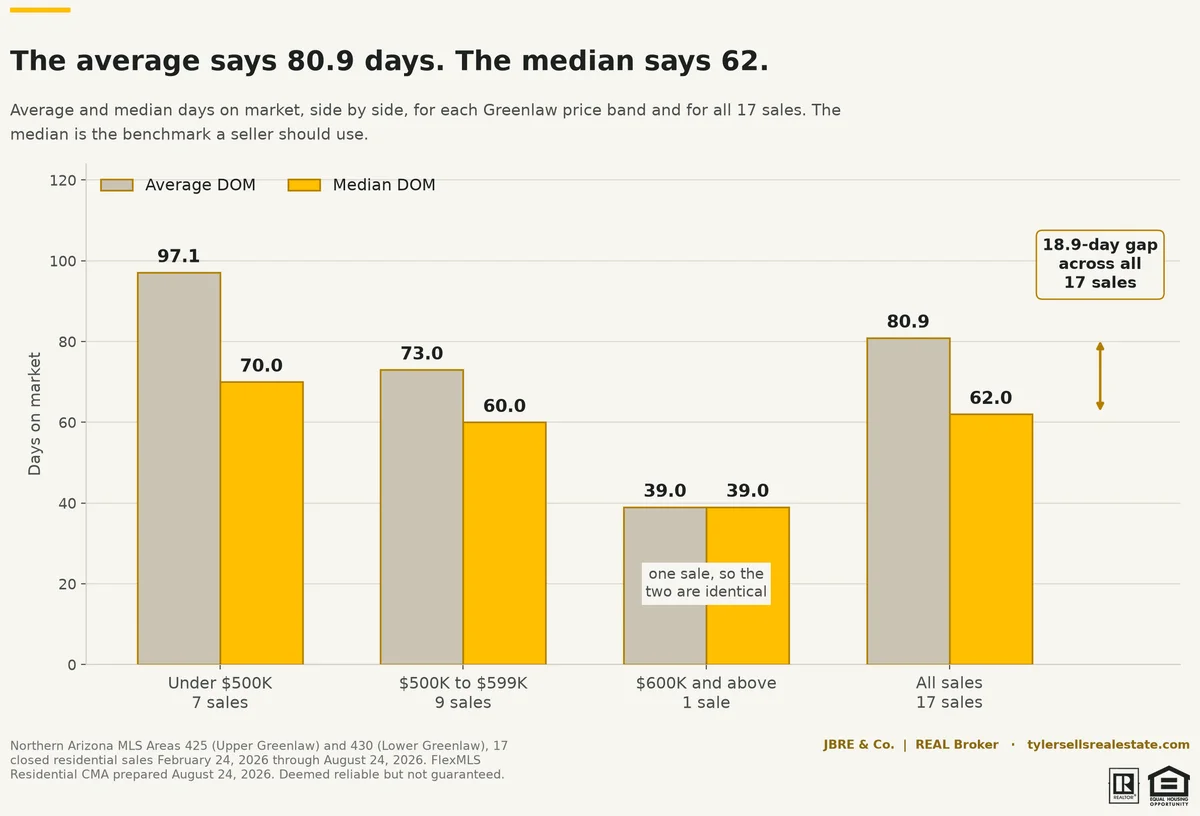
The seven Greenlaw sales under $500,000 averaged 97.1 days on market, the slowest of any band.
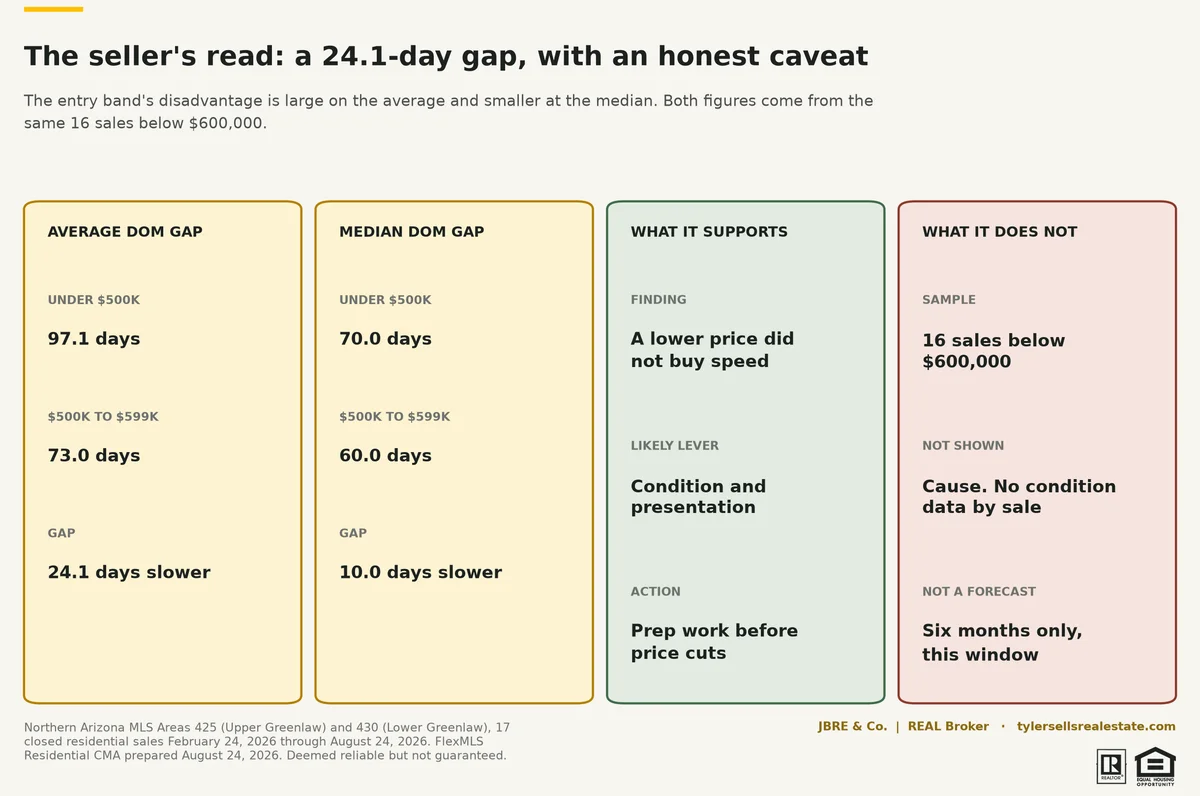
The nine sales between $500,000 and $599,999 averaged 73.0 days, a 24.1-day advantage on the average and 10 days at the median.
All 17 sales averaged 80.9 days, but the median was 62.0 days. Use the median.
One sale closed at $600,000 or above in 39 days. One sale is an anecdote, not a tier.
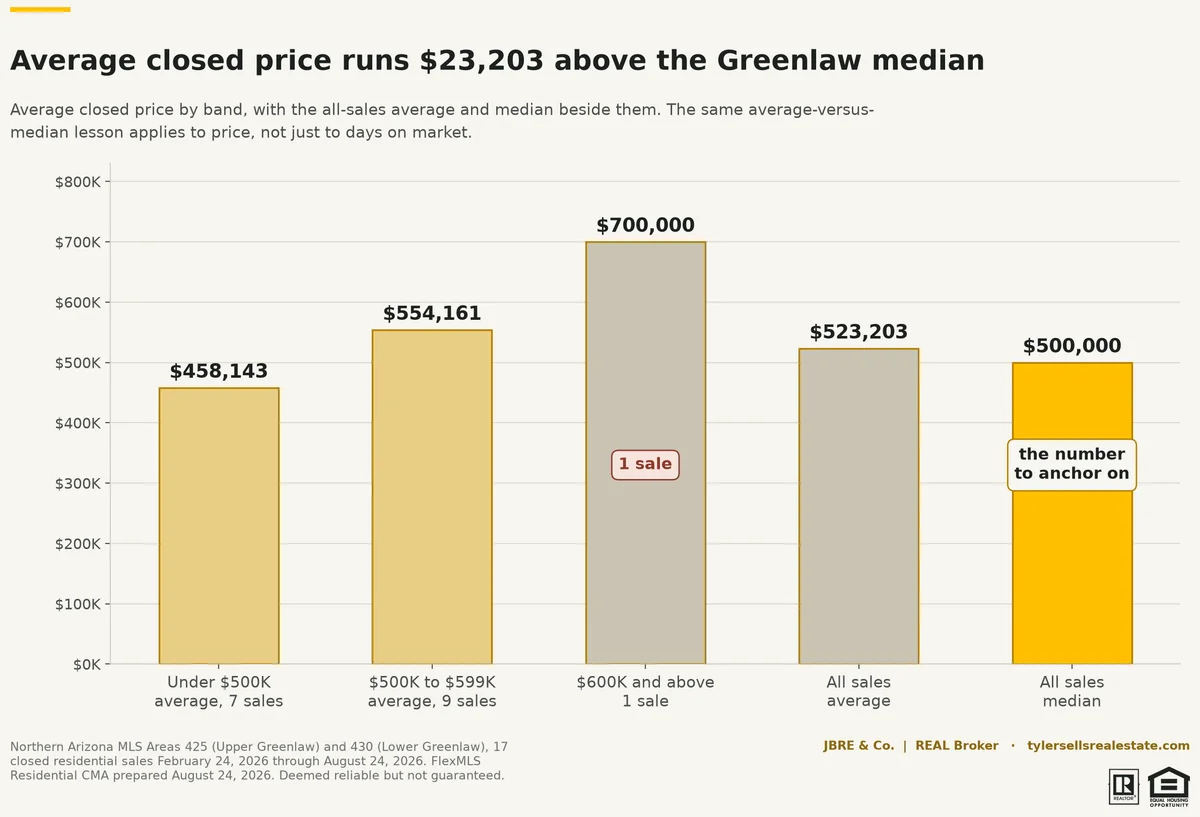
The average closed price across all 17 sales was $523,203, with a median of $500,000.
Seventeen sales across two MLS areas over six months is a small sample. Treat every pattern here as an observation about this window.
How long does it take to sell a house in Greenlaw Flagstaff?
Across the whole sample, the typical Greenlaw home took 62 days from list to close. That is the median of all 17 closed sales in Areas 425 and 430 for the six months ending August 24, 2026, per the Northern Arizona MLS Residential CMA prepared August 24, 2026.
The average for the same 17 sales was 80.9 days. Both numbers are accurate. They answer different questions, and the gap between them is 18.9 days, which is more than two and a half weeks of a seller's life.
If someone quotes you a Greenlaw days-on-market figure, the first question is which one they used. The second is how many sales it covers.
Why did the cheaper Greenlaw homes sell slower?
Here is the counterintuitive part. The seven closings under $500,000 averaged 97.1 days on market. The nine closings between $500,000 and $599,999 averaged 73.0 days. The cheaper band took 24.1 days longer on average and 10 days longer at the median, 70.0 versus 60.0.
The common belief is that a lower price buys speed. In this Greenlaw sample it did not.
That points at something other than the price tag setting the pace in the entry segment. Condition, presentation, and property-specific appeal are the variables the data leaves standing. An entry-priced house in Greenlaw is not being shown to a desperate buyer. It is being shown to a buyer with a short list of options who compares those options closely, item by item, and who can afford to wait for the one that does not need work.
That is a general market-practice read, not a Greenlaw statistic. What the Greenlaw statistic says is narrower and still useful: discounting into the entry band did not, in this window, correlate with a faster close.
Practical consequence: price and condition are two separate levers. Pulling the price lever harder does not substitute for the work the second lever does. If you want the speed, spend the effort where the buyer is looking closely. Our note on selling an older home in Flagstaff covers the prep decisions that matter most on Greenlaw's 1960s and 1970s housing stock.
Is average or median days on market more useful?
For a sample this size, the median. Every time.
An average absorbs outliers. One listing that took 212 days spreads its weight across all 17 sales and drags the whole figure upward. A median does not care how extreme the extremes are, only where the middle sits. That is why the Greenlaw average is 80.9 days while the median is 62.0.
Neither number is wrong. The average tells you about total market exposure across the sample, including the slow tail. The median tells you what a typical Greenlaw seller actually experienced.
When a neighbor, an online estimate, or a listing presentation quotes you a days-on-market number, ask three things:
Is it an average or a median?
How many sales is it built from?
What geography and what date range does it cover?
If the answer to any of those is vague, the number is decoration.
The four extended-market Greenlaw closings behind the average
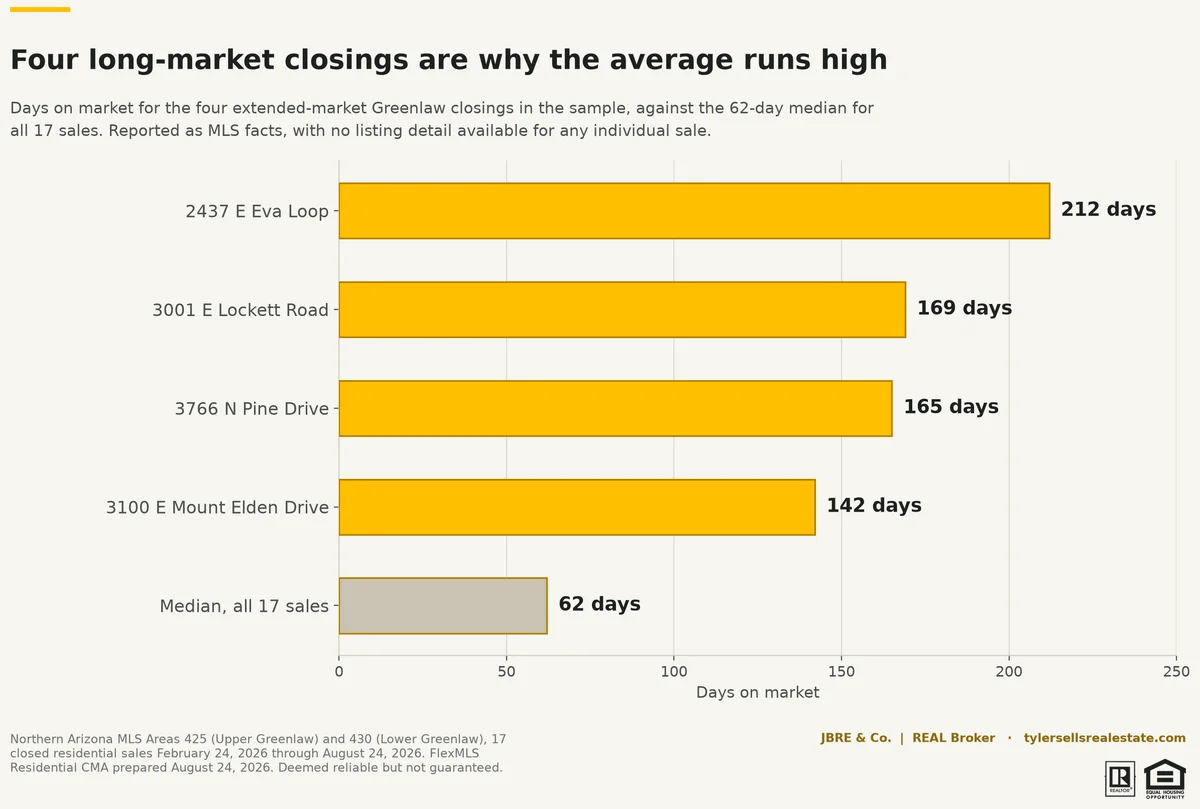
Four closings in this sample carried unusually long market times:
2437 E Eva Loop, 212 days
3001 E Lockett Road, 169 days
3766 N Pine Drive, 165 days
3100 E Mount Elden Drive, 142 days
These are MLS facts, not verdicts. We do not have the condition notes, price-change history, or listing detail for any of the four, so we are not going to speculate about why any individual one took as long as it did, and we are not naming agents or brokerages.
What they do explain is the 18.9-day gap between the 80.9-day average and the 62.0-day median. Four properties out of 17 is nearly a quarter of the sample, and they sat well above the middle of it. That is the whole mechanism, visible on one chart.
The lesson generalizes past Greenlaw. A single long-market comparable can distort a neighborhood average badly enough to change how a seller prices. It is why we quote medians in listing appointments and show the distribution behind them.
What the Greenlaw price bands show, band by band
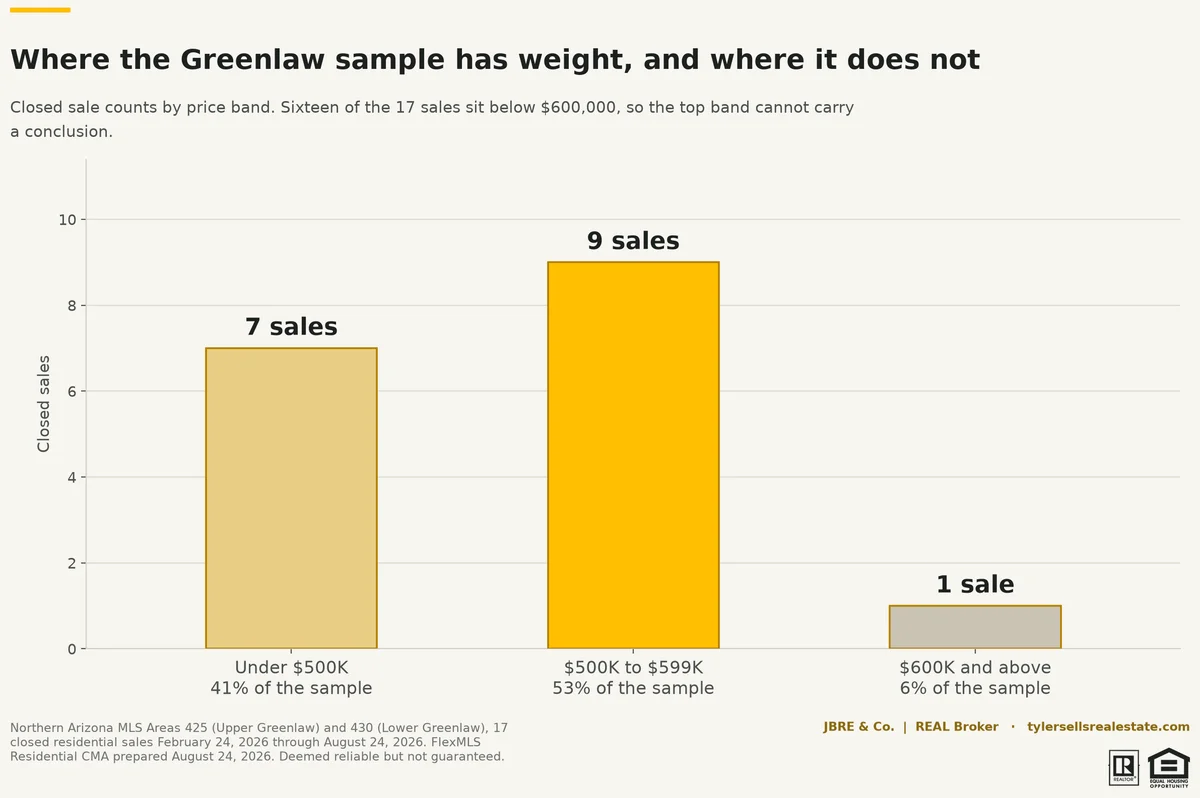
Under $500,000. Seven sales. Average 97.1 days on market, median 70.0 days, average closed price $458,143. The slowest band in the sample and the one with real weight behind it at seven closings.
$500,000 to $599,999. Nine sales. Average 73.0 days, median 60.0 days, average closed price $554,161. The largest band in the sample and the fastest one that has enough sales to be worth reading.
$600,000 and above. One sale. 39 days, closed price $700,000. Fastest number on the page and the least meaningful one, for a reason we will not soften: it is a single transaction.
All 17 sales. Average 80.9 days, median 62.0 days, average closed price $523,203, median closed price $500,000.
Notice that the average-versus-median lesson applies to price too. The all-sales average closed price of $523,203 sits above the $500,000 median, which tells you the price distribution is also pulled upward at the top. Same arithmetic, different column.
What the $600K+ Greenlaw result does not tell you
One sale, 39 days, $700,000.
It is tempting to read that as evidence that the upper end of Greenlaw is moving faster. Do not. A single closing has no distribution, no median worth calculating, and no way to separate the property from the pattern. If the next $600,000-plus Greenlaw home takes 150 days, the band average changes by more than 50 days and the story reverses on one data point.
Its correct use is as a caution. When you see a tidy band figure in any market report, look at the count next to it before you build a decision on it. In this sample, the under-$500,000 and $500,000-to-$599,999 bands carry seven and nine sales. Those are thin. The top band carries one. That is not thin, that is a single observation.
What should I price my Greenlaw home at?
We are not going to answer that from a blog post, and anyone who does without seeing the house is guessing. What this data does support is a short set of standards for the pricing conversation:
Start with the median, not the average. For the combined Greenlaw sample, 62 days is the benchmark.
Do not assume a lower price buys speed. In this window, the entry band was the slowest band. Price and condition are separate levers.
Spend on presentation where the buyer looks hardest. Under $500,000 the buyer is comparing a small set of options in detail, so prep work carries disproportionate weight. That is general practice, and this sample is consistent with it.
Look at the count behind every figure. Seven, nine, and one are all very different levels of confidence.
Expect one long comparable to distort the average. Ask to see the distribution, not just the summary line.
If you want the Upper Greenlaw view specifically, the Upper Greenlaw Flagstaff real estate market report covers Area 425 on its own, and Upper Greenlaw home values by condition tier is the companion piece to this one, because condition is exactly the variable the days-on-market spread keeps pointing at. Current inventory sits on the Upper Greenlaw Flagstaff homes for sale page.
How Greenlaw days on market compare with citywide Flagstaff figures
Careful here. The Greenlaw figures above cover 17 closed sales in MLS Areas 425 and 430. Citywide and metro figures cover a different geography, a different sample size, and different reporting periods, and the published sources disagree with each other. Do not average them together, and do not substitute one for the other.
For context, cited separately:
Best Flagstaff Homes reported 69 single-family sales citywide in July 2026 at a median sale price of $763,700 and an average of 76 days on market, with mortgage rates in the upper 6% range (Best Flagstaff Homes, July 2026 update).
The St. Louis Fed's median-days-on-market series for the Flagstaff metro area was 79 days in August 2026, up from 68 in July and 60 in June (FRED series MEDDAYONMAR22380, updated September 4, 2026).
Redfin put the Flagstaff median sale price at $700,619 for the three months ending June 2026, down 4.0% year over year, with median sold price per square foot at $394, up 5.3% (Redfin Flagstaff housing market).
Zillow published a $674,367 median sale price for Flagstaff through July 31, 2026, with a 0.986 sale-to-list ratio (Zillow Flagstaff home values).
Four sources, four different Flagstaff pictures. That is the normal state of this market's public data, and it is the reason a Greenlaw seller should be working from Greenlaw closings rather than a city aggregate.
Living in Upper and Lower Greenlaw: the local detail behind the numbers
Greenlaw is east Flagstaff, and the geography matters to the buyer pool. Lower Greenlaw sits north of Route 66; Upper Greenlaw sits north of Lockett Road. Several of the subdivisions were planned in the 1960s when Flagstaff needed housing, most of the homes went up through the 1970s, most were built with masonry walls, and the townhomes came later, in the 1980s and 1990s (Best Flagstaff Homes, Greenlaw neighborhoods).
Street names in this sample tell you the same thing: Eva Loop, Lockett Road, Pine Drive, and Mount Elden Drive are all established east-side addresses, not new-build cul-de-sacs.
The amenity set is unusually dense for a Flagstaff neighborhood at this price level. Bushmaster Park, at 3150 N Alta Vista, is one of the City of Flagstaff's three major regional parks, with lighted tennis and basketball courts, a sand volleyball court, a skate park, horseshoe courts, picnic ramadas, permanent restrooms, playground equipment, and a dog park (Best Flagstaff Homes, Bushmaster Park). The park exists because open space was preserved when the Greenlaw tracts were platted. A branch library, the east campus of Coconino Community College, North Country HealthCare, and the Coconino County Health Department on King Boulevard are all inside or adjacent to the area (Best Flagstaff Homes, Greenlaw neighborhoods).
Forest access is close. Greenlaw residents reach the National Forest trails at the base of Mount Elden by way of Swiss Manor and Skyline, and the Elden Lookout Trail No. 4 trailhead sits near the Flagstaff Mall on US Highway 89 in east Flagstaff, with parking for roughly 30 to 40 vehicles and a 2,392-foot climb over three miles (Coconino National Forest). In town, the Flagstaff Urban Trails System runs about 59 miles of shared-use pathway, generally eight to ten feet wide, roughly half paved and half hard-packed aggregate (City of Flagstaff, FUTS).
The setting is the same one that shapes every Flagstaff transaction: about 7,000 feet of elevation and an average of 108 inches of snow a year (Flagstaff Convention and Visitors Bureau). Snow load, roof condition, heating systems, and driveway grade are real diligence items on 1970s masonry housing stock, and they are the kind of thing a selective entry-band buyer inspects closely.
School attendance boundaries in the Flagstaff Unified School District changed for the 2026-27 year. Confirm the current boundary for any specific Greenlaw address directly with the district rather than relying on a portal listing page.
Method, sources, and limits
The Greenlaw figures in this article come from a Northern Arizona MLS Residential CMA prepared August 24, 2026, covering closed residential sales in MLS Areas 425 (Upper Greenlaw) and 430 (Lower Greenlaw) from February 24, 2026 through August 24, 2026. That is 17 closed sales.
Limits worth stating plainly:
Seventeen sales over six months across two MLS areas is a small sample. The patterns here are observations about this window, not forecasts.
Band-level figures rest on seven, nine, and one sale respectively. The single $600,000-plus closing is not a tier.
Days on market reflects list-to-close market time as reported to the MLS. It does not capture off-market prep time or pre-list price positioning.
Nothing here is an appraisal or a valuation of any specific property.
Figures from Northern Arizona MLS via a FlexMLS Residential CMA prepared August 24, 2026, and Coconino County records. Deemed reliable but not guaranteed.
Thinking about selling in Upper or Lower Greenlaw?
Nate works Upper and Lower Greenlaw specifically: pricing, comps, condition, and the details that decide whether your listing lands in the 62-day middle or the long tail. Get a straight read on where your home sits before you set a price.
Nate Thiesfeld, REALTOR®, JBRE & Co., brokered by Real Broker 336-848-3633 · nate@jbreandco.com
Equal Housing Opportunity.

Written by
Tyler Vaughan
Northern Arizona's top-rated real estate agent with 350+ five-star reviews. Specializing in Sedona, Flagstaff, and Northern AZ luxury properties.
Ready to Make Your Move?
Whether you are buying or selling in Northern Arizona, Tyler is here to help you navigate the market with confidence.